I called a bottom in gold and silver about a month ago. The problem is that miners didn’t listen — they kept going lower. Well, that’s changed. Miners are now leading the metals higher. Is that bullish for metals?
You can bet your silver buttons it is. I’ll show you why in three charts.
Here’s the first chart. It shows the performance in gold, as tracked by the SPDR Gold Shares (NYSE: GLD) and the VanEck Vectors Gold Miners ETF (NYSE: GDX). I added the Global X Silver Miners ETF (NYSE: SIL).
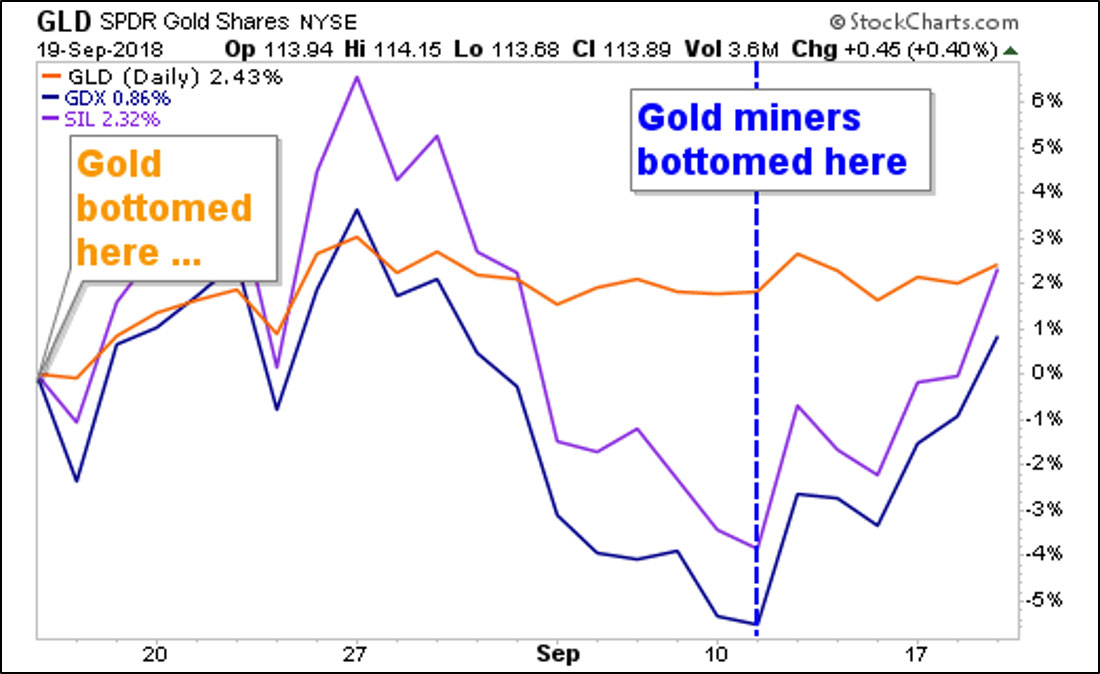
Gold bottomed on August 16, right about where I called it. But gold and silver miners didn’t bottom until September 11.
Since then, the mining ETFs have been on a tear. Both of them are up about 6%. Gold, meanwhile, has drifted higher, but hasn’t made a lot of headway. Yet.
That’s fine. This is exactly what you expect to see in a bull market. Miners lead the metals higher.
Here’s another chart that is bullish on the precious metals. I’m talking about the gold-silver ratio. It’s a chart I made on my Bloomberg terminal …
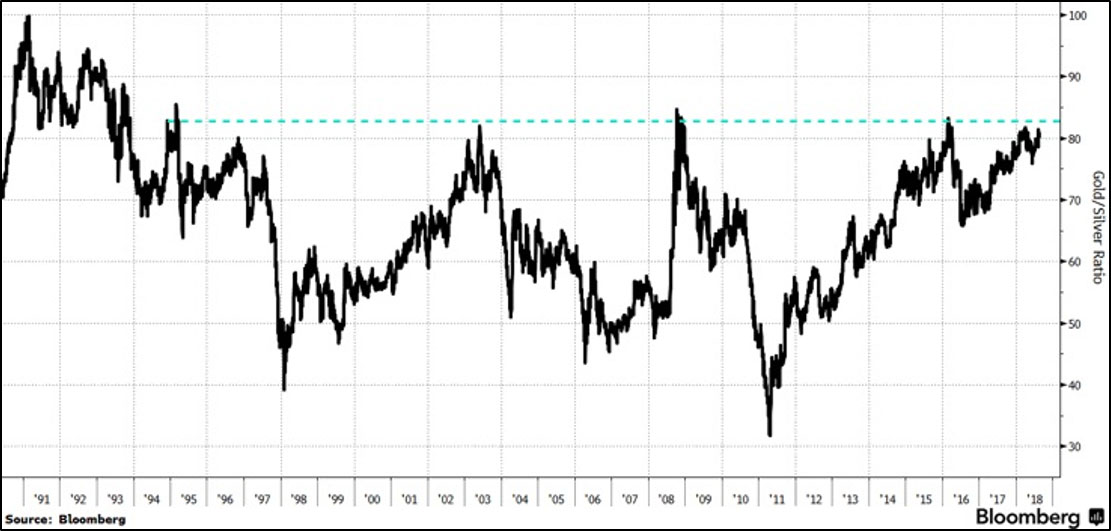
This is the price of gold divided by the price of silver. Or to put it another way, how many ounces of silver it takes to buy an ounce of gold. Currently, it takes nearly 85 silver ounces to buy one ounce of gold.
We haven’t seen this ratio this extreme since 1995. And this shows extreme bearishness on both gold and silver.
Why? Because silver is the drama queen of the metals. When gold is up, silver reaches for the stars. When gold is down, silver falls face-first on the ground.
The interesting thing about this ratio is what follows. In the past, this has been followed by a gain in silver of between 20% and 35% over the next six months.
And for gold? It usually gains between 10% and 18% over the same time.
Again, silver is the drama queen. It outperforms, both going up and going down.
And it seems like some smart investors already suspect this. Because look at the recent action in ETFs that hold physical gold and silver. Here’s another chart I snagged from Bloomberg …
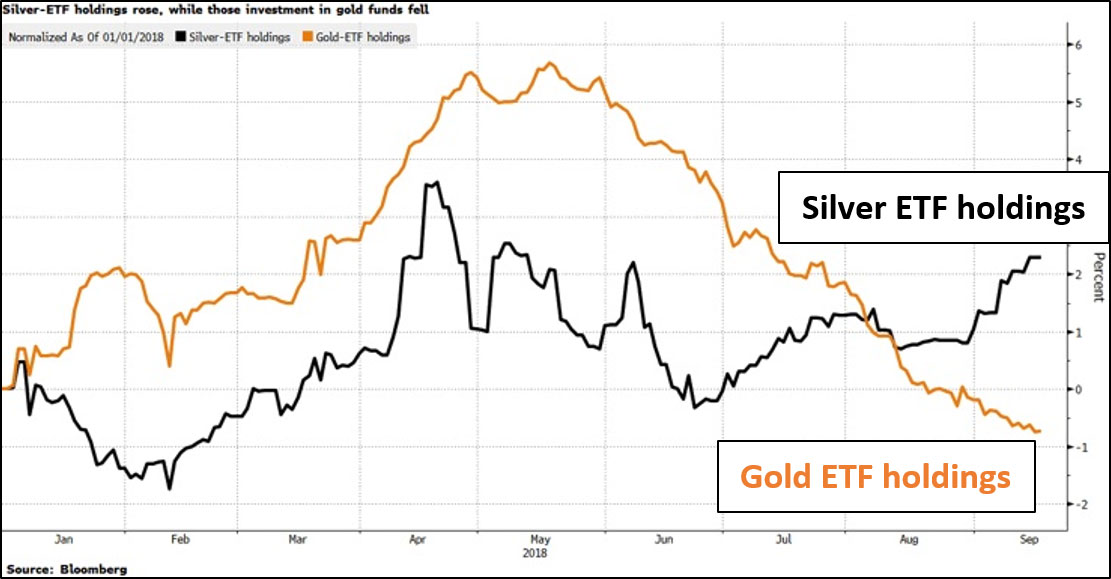
While ETF holdings backed by gold have fallen 1.3% this year, those tracking silver have climbed 2.3%. It sure looks like somebody in the know is swapping their gold for silver — the better to ride the big move to come.
If, after seeing these charts, you also believe precious metals are going higher, you can set yourself up to profit handsomely. Consider buying a miner that is highly leveraged to the price of gold … or silver … or both.
That’s what I recommended to my Supercycle Investor subscribers this week. I think they’re glad I did. I’ll have more picks for them soon — and you should get ready, too. When the next surge in precious metals begins, it could be a doozy!
I’ve called the bottom — but the top could be farther than most people dream possible.
All the best,
Sean
P.S. Do you want more insights on metals? Then you MUST attend the New Orleans Investment Conference. New Orleans is a great city anyway, and this is an excellent conference. Doug Casey, Rick Rule, Brien Lundin and many other razor-sharp investors will share their insights with attendees. If you want to find more about it, CLICK HERE. And I hope to see you there.