There is a big squeeze going on in gold miners right now.
The last time this signal showed up, gold miners went soaring by 51%. The blast-off hasn’t happened yet. But if you get in before the blast-off, you could be in for a heck of a profitable ride.
I’m talking about the squeeze in the Bollinger Bands on a chart of the VanEck Vectors Gold Miners ETF (NYSE: GDX). The GDX is an ETF stuffed with the biggest gold miners, and is used to track the industry as a whole.
And right now, it’s SQUEEEEEZE time …
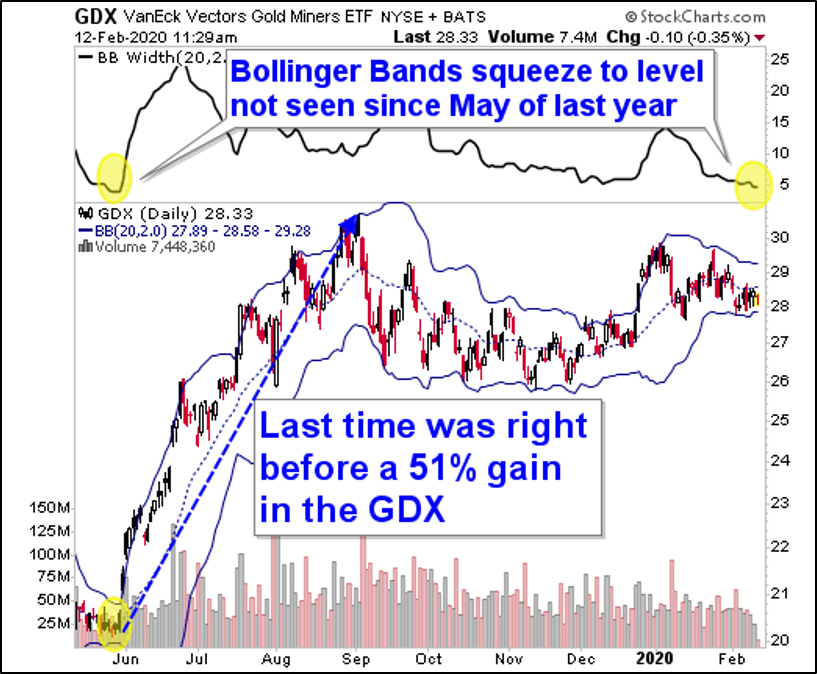
The Bollinger Bands have tightened to a level not seen since May of last year. And that squeeze was followed by a massive, 51% rally in the GDX.
So what are Bollinger Bands anyway? They are a popular technical indicator used on stock charts, invented by a guy named John Bollinger. Generally speaking, 90% of a stock’s total price movement will happen within the confines of Bollinger Bands.
The more wild the swing in a stock, the wider the Bollinger Bands get. The more tightly a stock trades, the more the bands constrict.
The Bollinger Band Squeeze occurs when volatility falls to low levels and the Bollinger Bands narrow. And according to John Bollinger, periods of low volatility are often followed by periods of high volatility.
In other words, a big breakout. The only question left is which way will gold miners break — up or down?
I strongly believe this one will break up. Way, way up.
Why? Because GOLD itself is poised to rocket. After all, there are fundamental forces lining up to push gold higher.
Governments Are Firing the Liquidity Cannons. In Asia, Europe, Japan and here at home, govenrments are injecting money into their banking systems. They say it’s for stability, but all that money has to go somewhere. It’s secret inflation at work!
Negative Interest Rates. One way that governments are injecting liquidity is by slashing interest rates. Money simply becomes too cheap not to borrow. But a side effect is that, historically, when interest rates go negative, gold goes higher. Potentially much higher.
Central Banks Are Buying Gold. Central banks bought gold at a record pace in 2019. Global reserves grew by 684 metric tons.
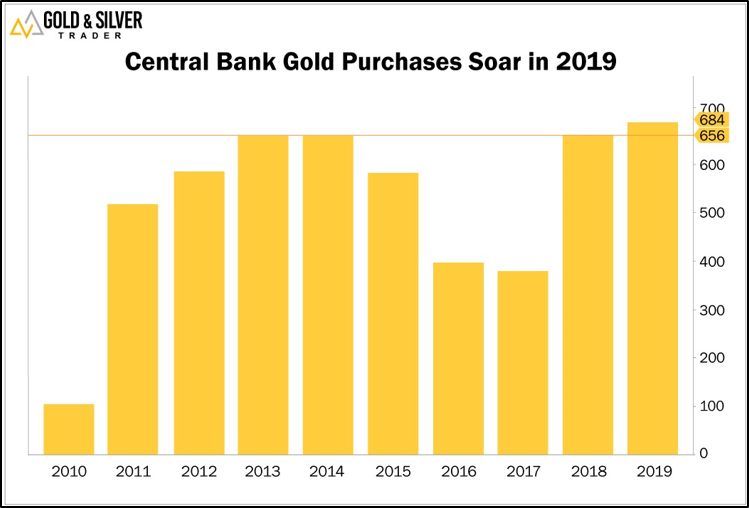
That’s a fifth of the world’s supply. Only 2018 saw bigger purchases, a record that stretches back 50 years!
Supply/Demand Squeeze. Total gold supplied by the world’s mines fell 1% last year, to 3,464 metric tons. That was the first year-over-year decline since 2008! The cheap, high-grade, easy-to-dig-up gold has already been mined.
Bottom line: The next big move in gold is coming soon. Select miners, leveraged to the metal, are on the launch pad. You best get your own ticket on that golden rocket, and soon.
You can buy the GDX. Or you can do the hard work and research and buy individual miners for potentially bigger rewards. It’s up to you.
Either way, I personally recommend you check out this video I made before we take it offline TONIGHT! I’ve identified three of the best ways to play this coming gold rally. If you want to get into gold — as I highly recommend — click here.
All the best,
Sean